


Yearly (Q4) Wealth Growth Update - Part 1
📈 80.79% Yearly Return / ⬆️ 28.2% 8 Year CAGR / ✔️ Doubling Sub 3 Years


Ho, ho, ho - Merry Christmas!
‘tis the time for a bumper end of year post where I look back on the year, reflect upon it and gaze to the horizon and ponder over what it may bring.
🎉 End of Year Results
📈80.79% Yearly Return / ⬆️ 28.2% 8 Year CAGR / ✔️Doubling Sub 3 Years
My goal is to track at 30% growth per year. This was the end of the 8th year of me tracking Compound Annual Growth Rate (CAGR).
30% growth per year would yield the following multiplier on money invested:
10 years - 13.79 x
20 years - 190 x
30 years - 2,620 x
40 years - 36,119 x
📖 Overview
This has been another year of COAST Fire, meaning I didn’t add any contributions. As of right now, any money we have beyond expenses goes towards Vacations and toys. Next year I’m planning on buying a Dirt Bike for myself as I’ve been loving riding the kids bikes in the mountains.
Side note - sadly it looks like KTM are early stage bankruptcy.

I’ll also be looking for a cheap, reliable vehicle in 2025. Easier said than done - the car market looks insane.
This year we took a vacation to San Diego and one to England. Both were amazing totaling around 5 weeks.
Going forward, I want to grow and scale a business and to get into Multi Family Real estate so at some point in the future will try to pull together a down payment.
📬 Reasons To Subscribe
As a paid subscriber, I show everything that I am doing, why I am doing it. I’m a pureblood contrarian that watches the horizon closely for threats and opportunities and relays them in this newsletter.
~$100 dollars of a membership cost will bring you closer to my and actions. Or if you are wanting to test the waters - try a month-to-month subscription.
I write about:
💰 Wealth
🍎 Health
🌱 Self Improvement
🗽 Sovereignty

🙏 Thank You
A big thank you to all paid Subscribers. Your paid membership does two things:
It is a direct signal that helps me measure the value of my writing
It holds me accountable to creating more quality content
If there is specific content or areas you’d like me to zoom into further please let me know. When I started writing I didn’t know what topics would emerge, but since starting it has become emergent.
Freedom is becoming more and more of a core value to me as I get older. Freedom and wealth go hand in hand. As an investor you get to choose which side of the coin you are on. And when the coin lands on the other side, you get to move to that side at the blink of an eye.

Disclaimer: The content provided is for informational purposes only and reflects my personal experiences and opinions. It is not intended as financial advice. Please consult with a licensed financial advisor before making any investment decisions.
🎆 A Firework
A few years ago on a different platform I wrote that the USD would be like a firework. It would shoot up into the sky, way above everything else. Then pop.
So far it is heading that trajectory.
In my opinion, inflation is yet still ahead of us. Food prices should seem cheap now compared to in five years time. My assumption is that rate cutting will carry on and the bubble will continue to grow.
My other assumption is that the United States will be looking for a fight.
I think it would be prudent to buy non-perishable food and which ever consumer goods you can now before the prices rise.
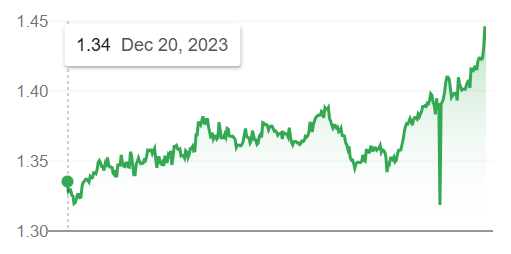
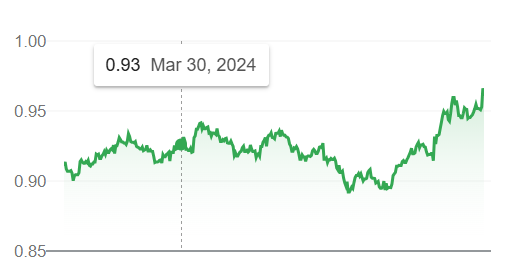
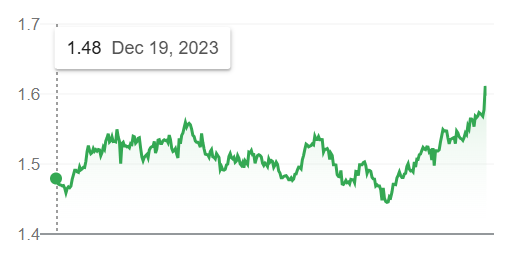
Inspecting the idea of the Firework, here are some leading currencies for the last year versus the USD.
🔴 S&P 500
Expensive: I see the S&P 500 as over priced.
A rising tide carries all boats.
Don’t get caught up thinking that boat is necessarily a good investment. Malinvestment is a thing
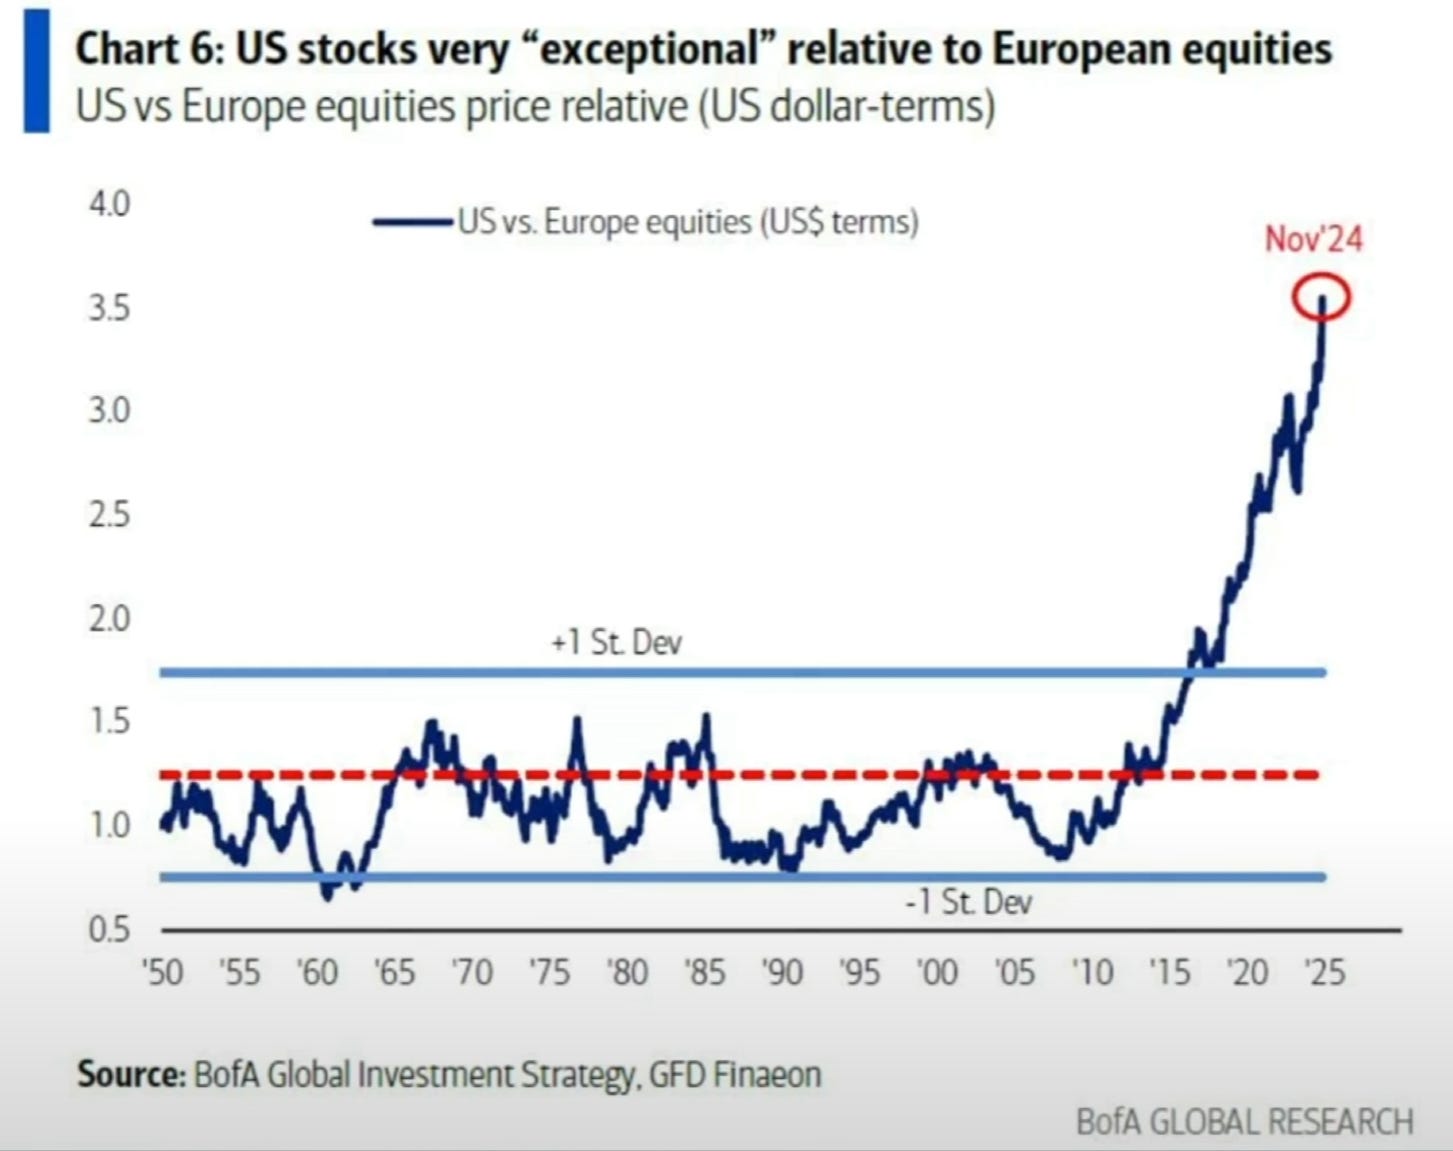
Lets take a look at why I think the S&P 500 is overpriced. This first chart came from Mike Maloney, showing the overweight allocation to USA, neglecting Europe.
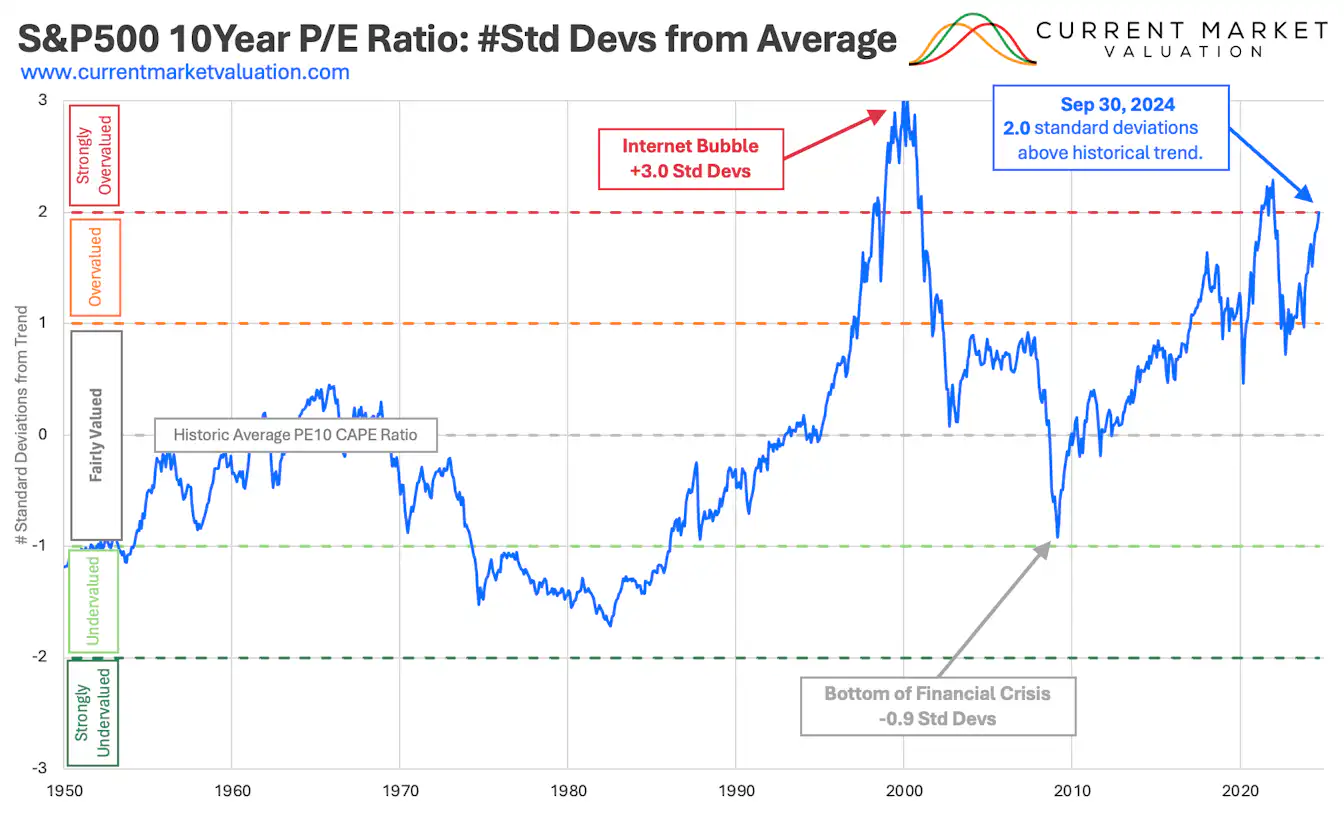
The chart above shows Price (how much you pay for the stock) relative to how much the stock’s earnings are, expressed as a Standard Deviation.
As you can see from the bell curve pictured below, extreme values are very rare. Reversion to the mean (mid point in the chart below) is a natural law meaning that extreme things will likely snap back to the mean.
With standard deviation of 2 - 97.72% of values are to the left of this point.
Or said another way, maintaining this current, upward trend, only 2.28% of values on the chart are beyond where we are at. The likelihood of this continuing is improbable.
Notice the trend line going up on the far right of the picture - this is not a good direction.

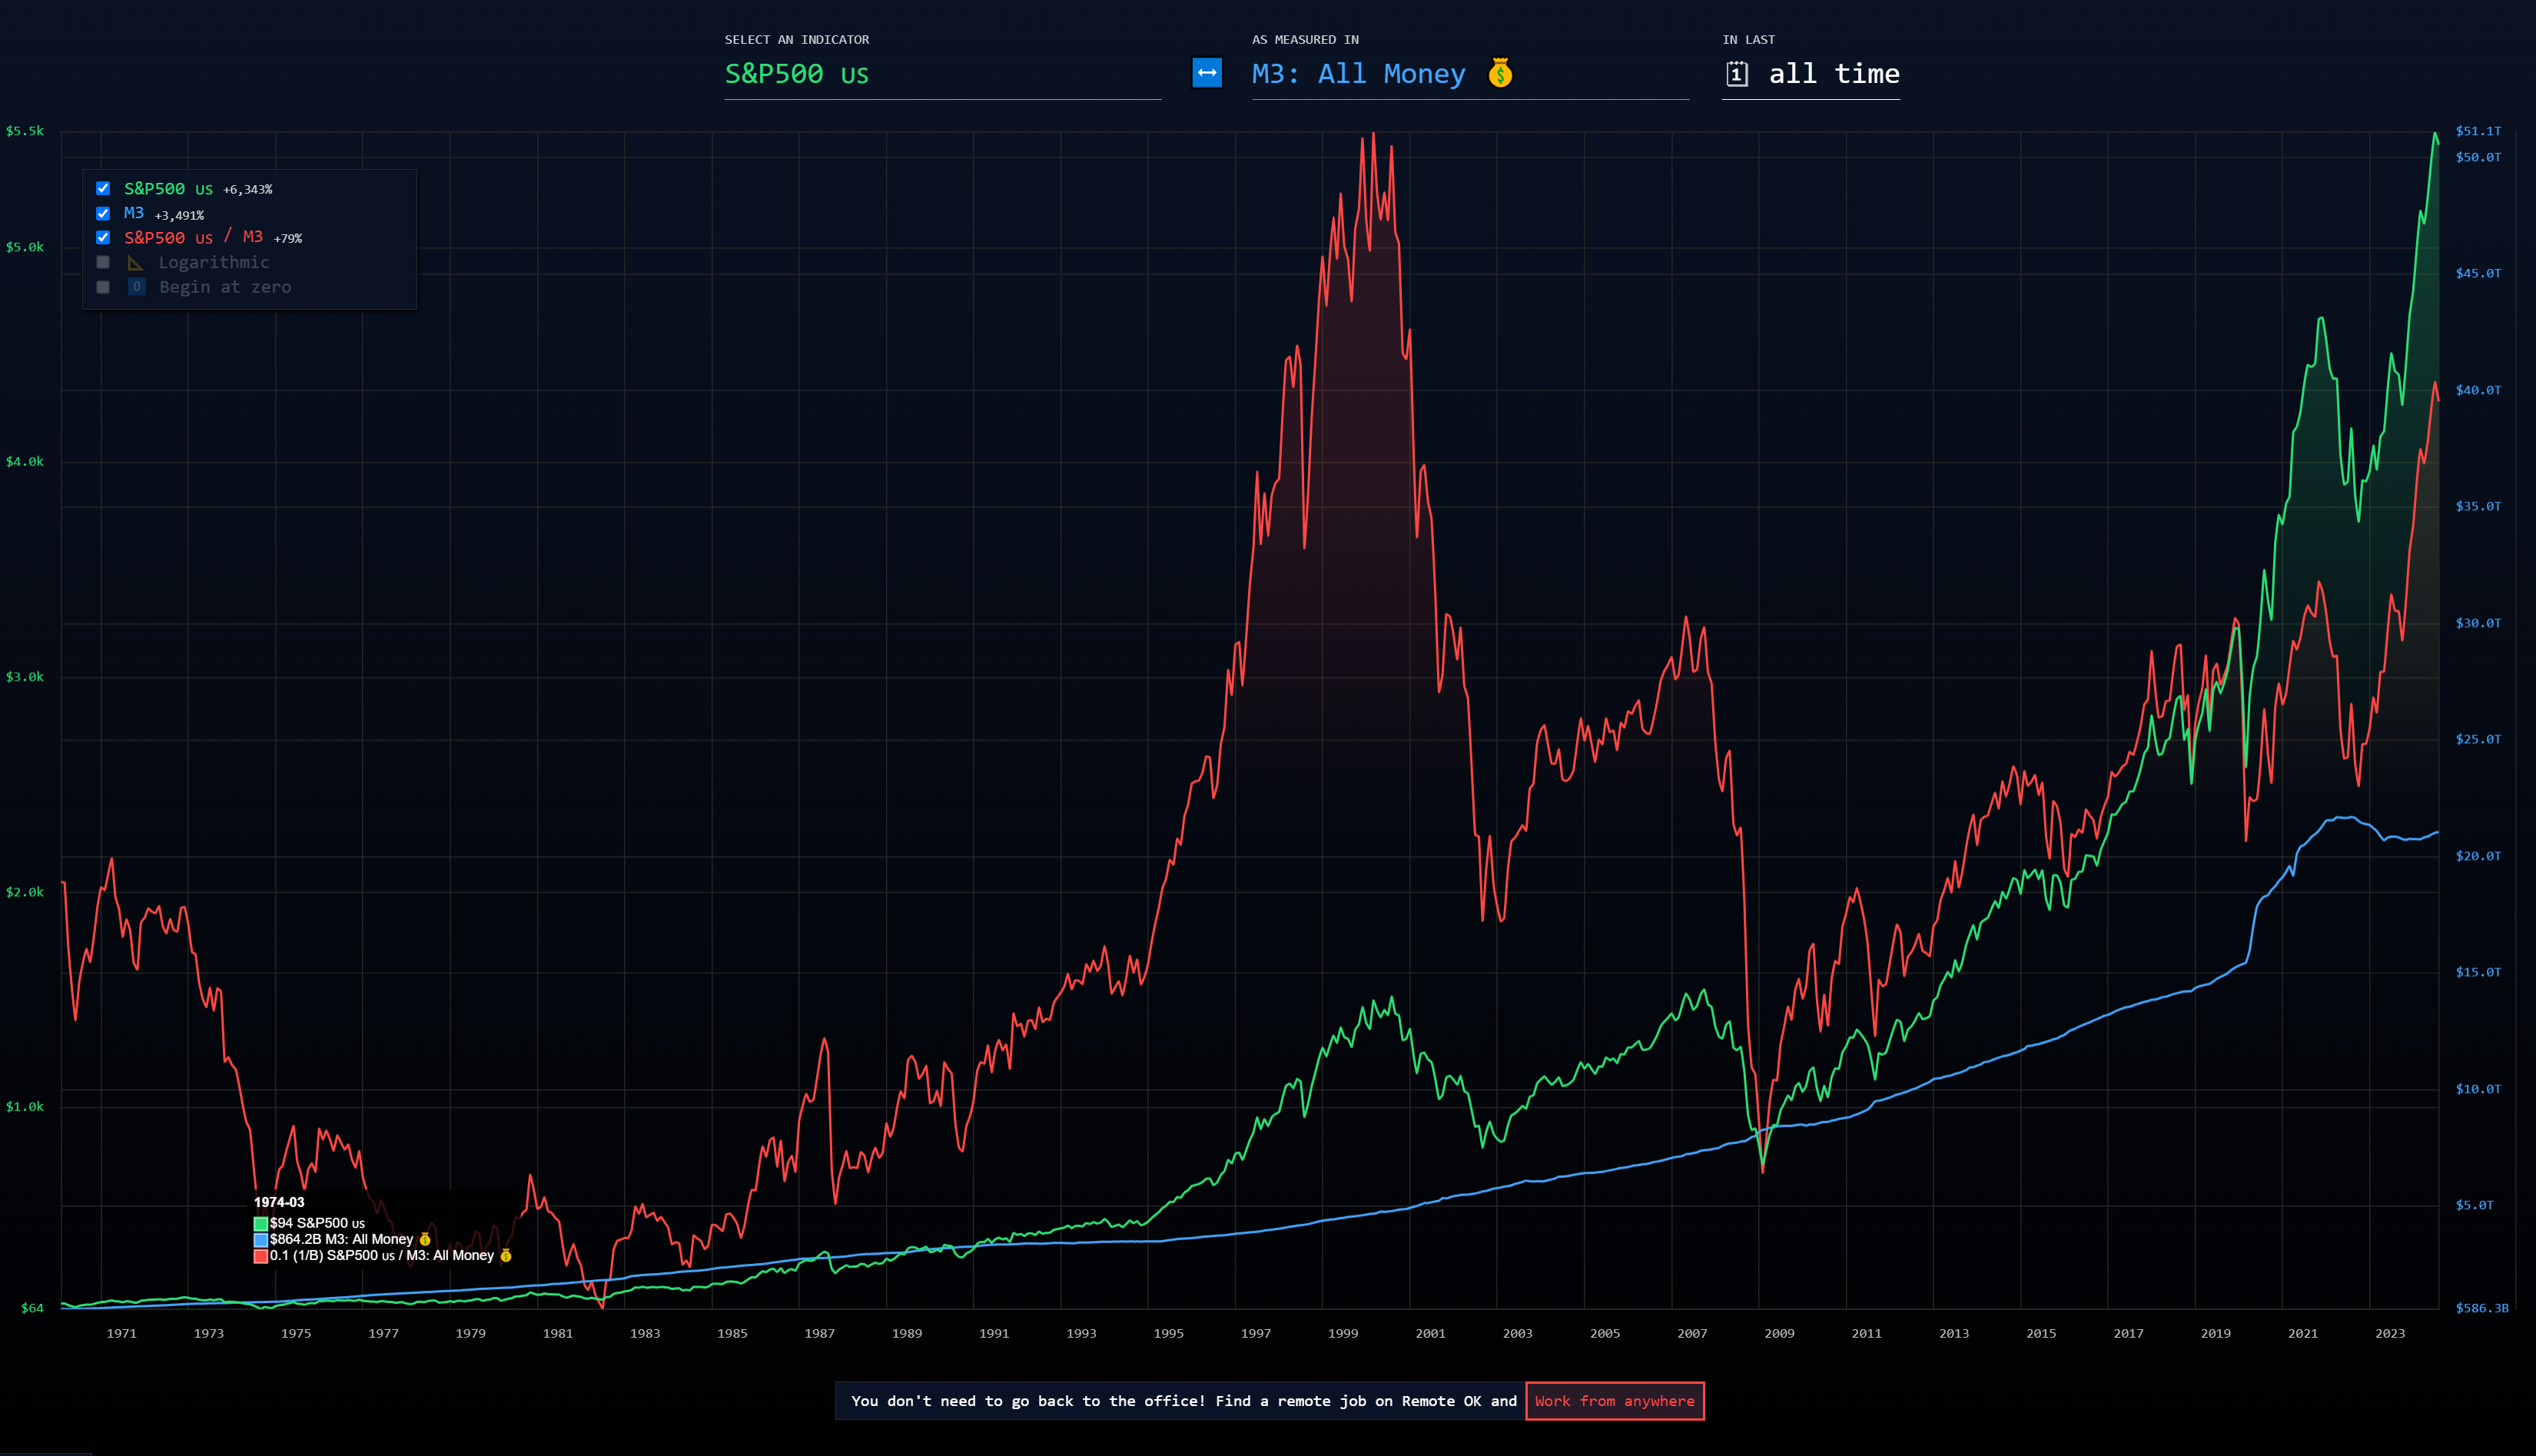
In this chart taken from inflationchart.com, the red line shows the correlation between printed money (M3 money supply) relative to the S&P 500.
Or said another way the rise in the stock market is heavily attributed to the issuance of new money rather than an objective value increase.
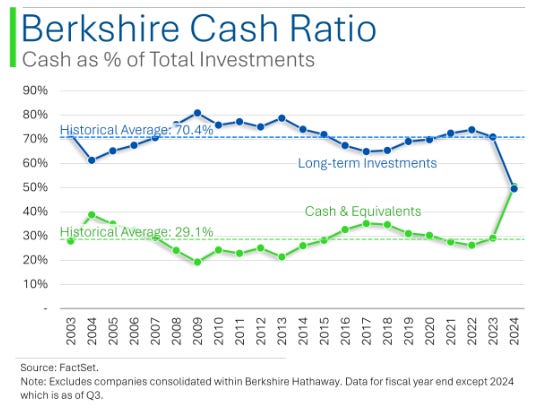
This next chart shows renowned investor Warren Buffet’s cash allocation within Berkshire Hathaway.
I’ve seen various numbers reported between 30-50% - either way, both are extremely high from a cash point of view.
Warren sees no investment opportunity beyond his hurdle rate. Hurdle rate is a baseline for what you would measure an investment relative to. For example if something was zero risk and yielded 7% you would be looking for an investment that was higher than 7% when there was risk attached to it - such as investing in in a company.
📈 Wealth Growth Formula
Regarding capital allocation, I follow my own Wealth Growth Formula , which effectively means I am against Dollar Cost Averaging.
I don’t see the S&P 500 as being a good investment, given its price - I would not contribute more money towards it.
Do I think it will continue to rise?
Yes - absolutely.
See the inflationchart.com chart for the reason why. If you are stumped, read The S&P 500 - Peasant Mechanics
This is the first part of the Yearly (Q4) Wealth Growth Update - keep an eye out for the following part(s) where we continue to unpack the year and the other asset classes.